Linear Regression
-
Terakhir update : 9 Arpil 2022
source : StatQuest with Josh Starmer
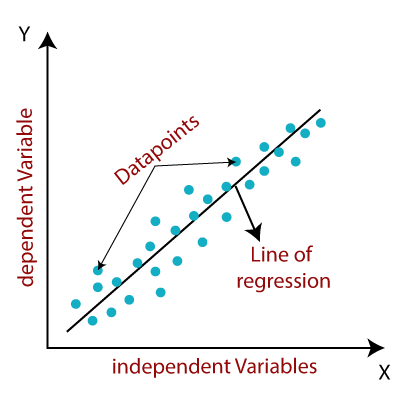
Least Squares
\(y = a*x+b\)
\(\sum R = (y - y_1)^2 + (y - y_2)^2 + ... + (y - y_n)^2\)
- \(\sum R =\) sum of squared residuals
mencari nilai \(a\) dan \(b\) yang optimal, dalam matematika general ditulis dengan persamaan
\(\sum R = ((a*x_1 + b) - y_1)^2 + ((a*x_2 + b) - y_2)^2 + ...\)
Code
proses perhitungan sangat sulit jika dilakukan secara manual oleh manusia, maka diperlukan bantuan mesin
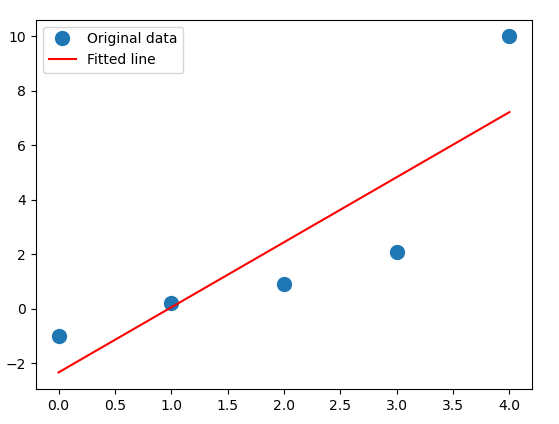
Cara 1
import numpy as np
import matplotlib.pyplot as plt

x = np.array([0, 1, 2, 3, 4])
y = np.array([-1, 0.2, 0.9, 2.1, 10])

A = np.vstack([x, np.ones(len(x))]).T

m, c = np.linalg.lstsq(A, y, rcond=None)[0]

_ = plt.plot(x, y, 'o', label='Original data', markersize=10)
_ = plt.plot(x, m*x + c, 'r', label='Fitted line')
_ = plt.legend()
plt.show()
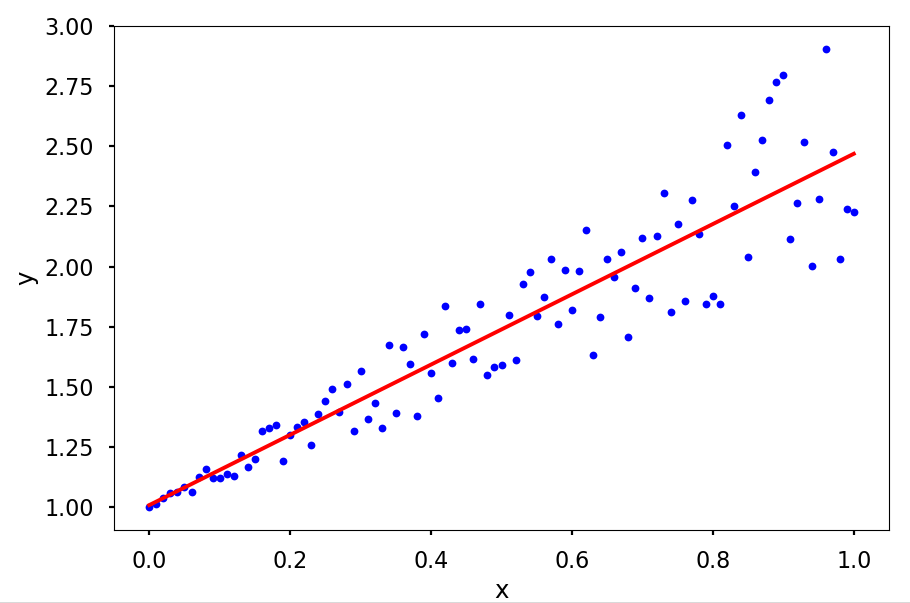
Cara 2
import numpy as np
from scipy import optimize
import matplotlib.pyplot as plt

plt.style.use('seaborn-poster')
# generate x and y
x = np.linspace(0, 1, 101)
y = 1 + x + x * np.random.random(len(x))
# assemble matrix A
A = np.vstack([x, np.ones(len(x))]).T

# turn y into a column vector
y = y[:, np.newaxis]
# Direct least square regression
alpha = np.dot((np.dot(np.linalg.inv(np.dot(A.T,A)),A.T)),y)
print(alpha)
# plot the results
plt.figure(figsize = (10,8))
plt.plot(x, y, 'b.')
plt.plot(x, alpha[0]*x + alpha[1], 'r')
plt.xlabel('x')
plt.ylabel('y')
plt.show()